Scriptcase
101
Everything you need to know to get started from scratch.
New at Scriptcase and not sure where to start? Access our online trial version and follow this guide for a quick and painless test.

1 - Create
First, you need to create a new project by clicking the button "Create project".
Create a Blank Project
A new page will be shown with options to create a brand new project or choose one of the system templates.
For now, we'll just need to "Create a Blank Project".
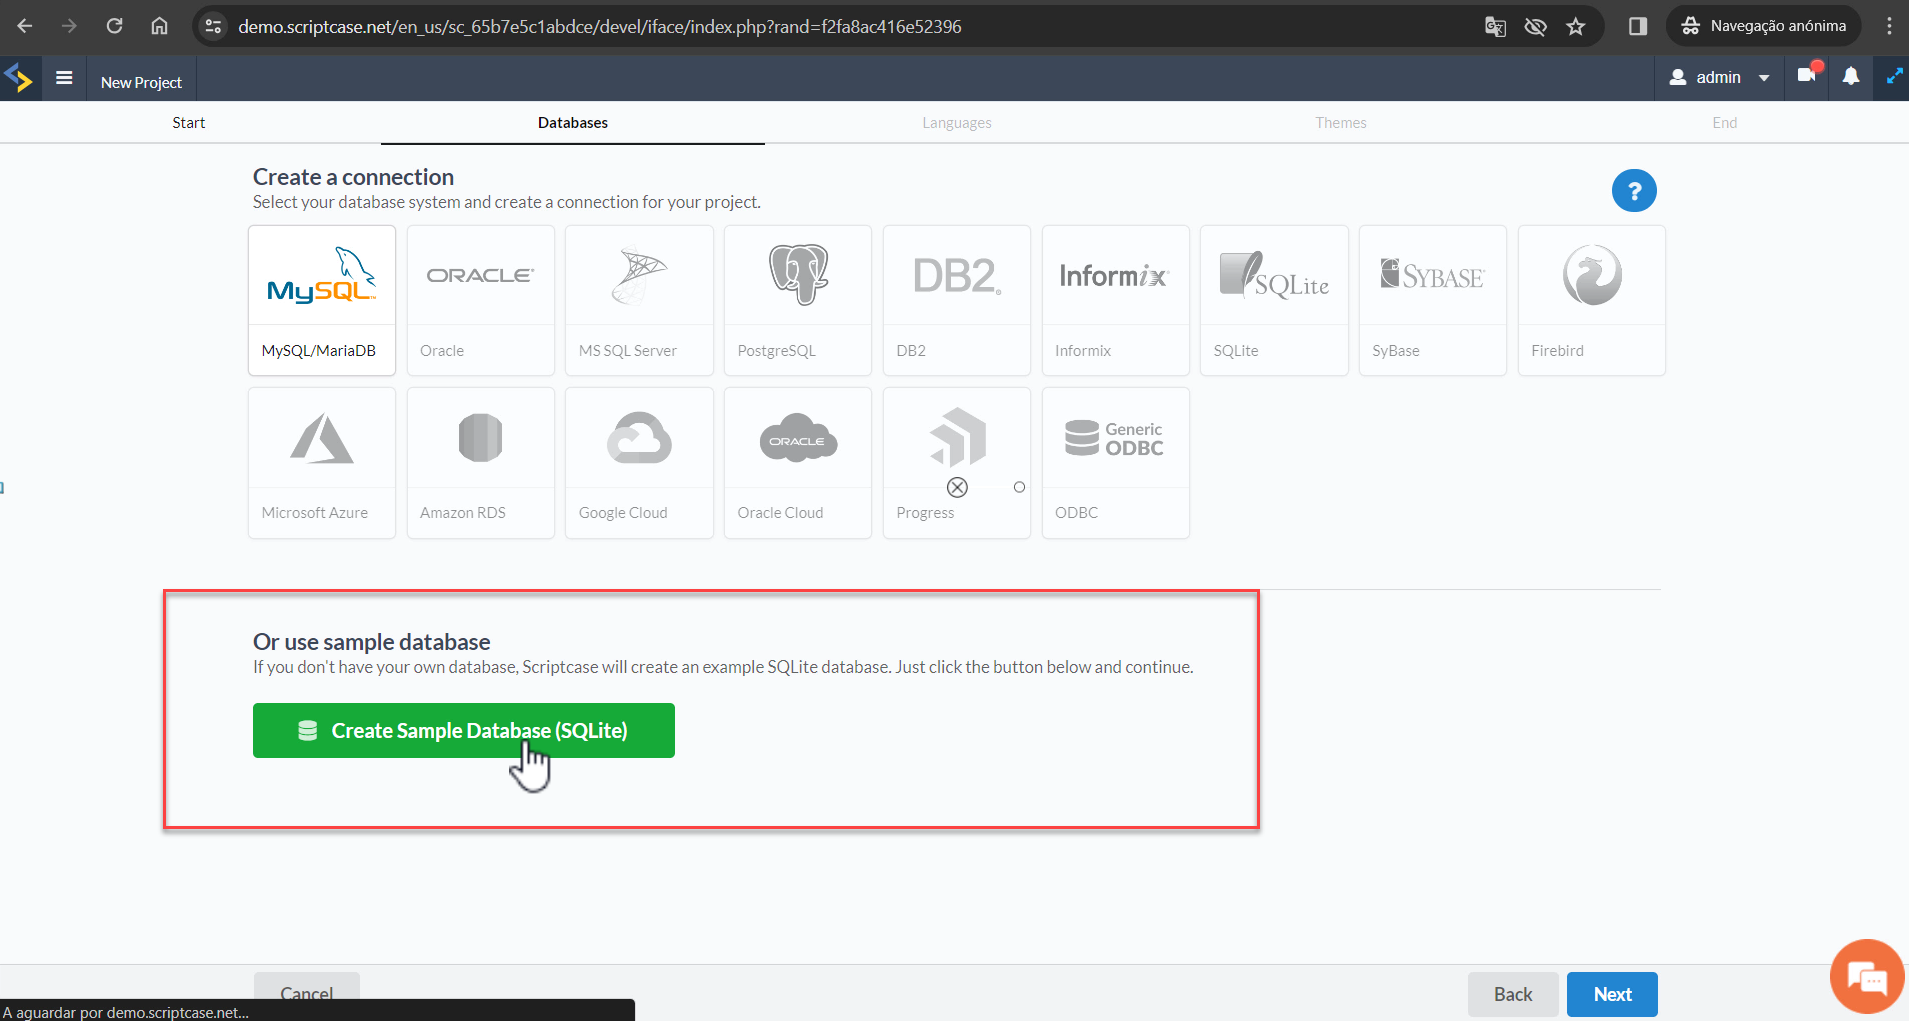
2 - Connect
Now use our sample database (SQLite) to run your tests.
Click to continue creating your project.
To use all available databases, you have to download Scriptcase ![]() .
.
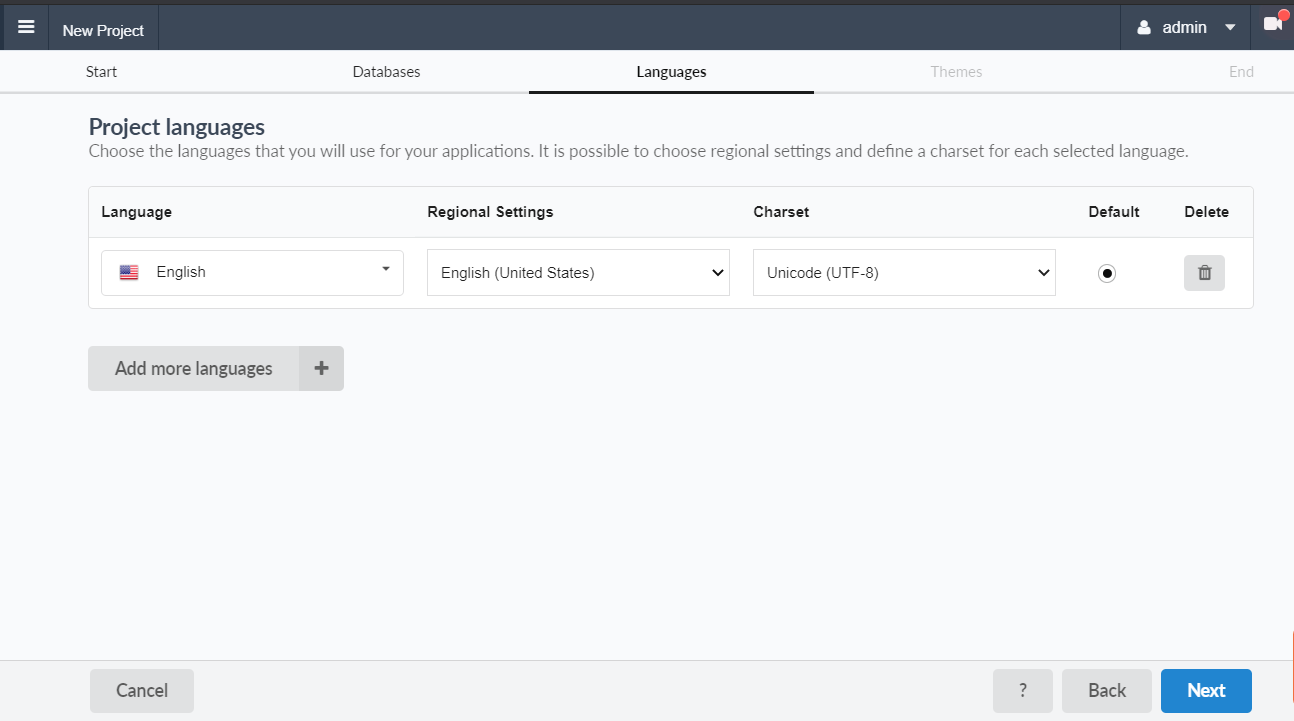
3 - Settings
Set a language
Select the language and regional settings, and Scriptcase will apply and translate your project.
For now, click to proceed.
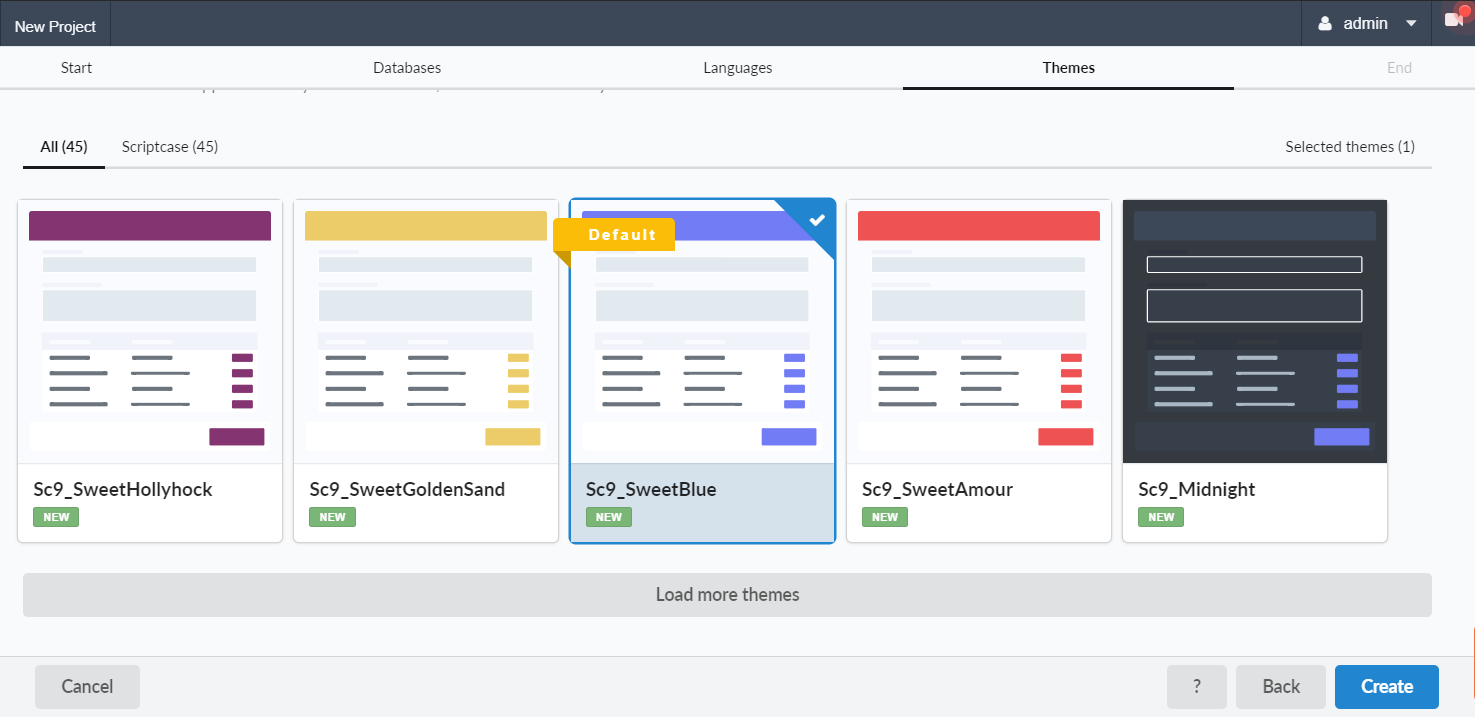
Set a theme
Here, you choose the application layout. Pick up one of the ready-made themes and customize them whenever you want.
Choose your theme templates, and click button to finish the process.
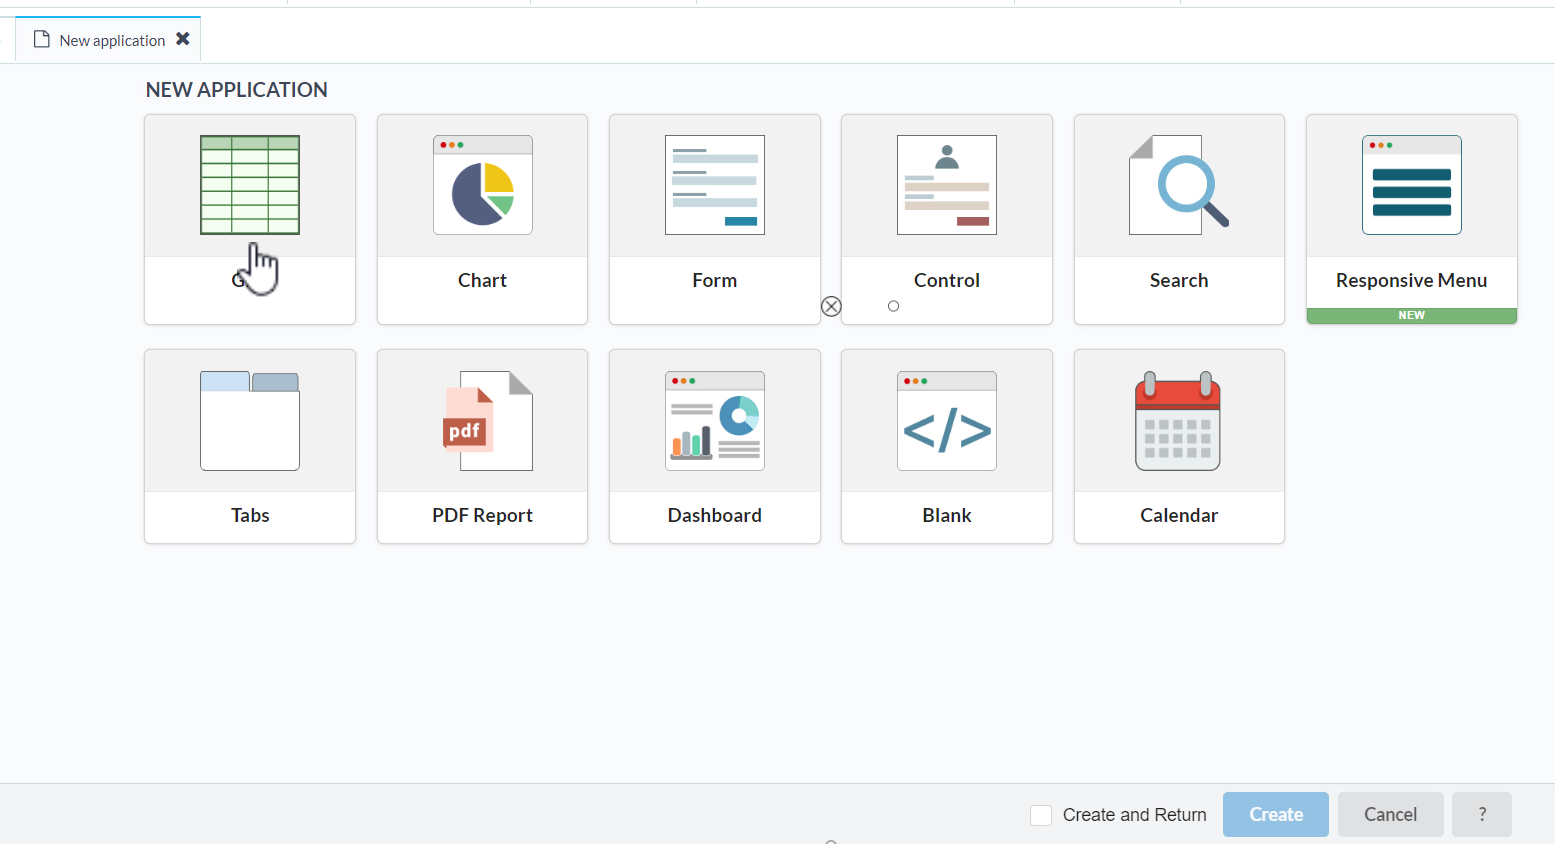
4 - Build
Grid & Form application
We have prepared a quick example showing how you can create your first applications.
So, let’s choose a "Grid" and click to continue.
Within the field "Table", you select the table "Sales" and check if the options "Create also a Form to edit the Grid" and "Run application after creation" are active.
Click the button and wait for the preview.
Scriptcase will create a Form and a Grid to view and browse your records.
A new browser tab must be made with the generated applications for preview and testing. If it isn’t open, check your browser permissions.
You can also test reporting features generated by this application using group by options. Access the menu Group by and create a Static Group by dragging the fields Date (year) and Product_Category to the “Group by fields” area and the field Sales (sum) to the Summary totals area.
Run the application to see the result.
Once you group the fields, Summary and Chart modules will be available. You will see the data grouped according to your field selection and using the button
Great job! 

Now, you can explore some options such as searching, exporting, editing, or creating a new record, choosing the columns, and sort dynamically.
Chart application
To create access, use the menu "Application > New application" and then select the "Chart" Application.
Choose the table "Sales" and click .
Let's create a chart to display "Categories" records by year in three steps:
1. Drag the field "Product_category" and drop it to the "dimension" column.
2. Then, drag the field "Date" and drop it to the "dimension" column.
3. To finish, drag the field "Record Count" and drop it into the "metrics" column.
Click the  button and wait for the application preview.
Well done!
Your chart is ready, and now you can explore the application and test different features and chart types.
Did you get success


Make sure you did all the hilighted steps
from the
top ↑
.

Congratulations!
You have created your first application, just easy like that!
Impressed?
Now that you have tried how powerful Scriptcase can be, we recommend you to go further and create a sample project using your database.
Download

Download Scriptcase and try for free 20 days,
no credit card needed.
What's next?
Have a quick overview of the primary resources of the tool!
The best content is waiting for you
Blow your mind with the complete demo of Scriptcase, watch courses & series, read the documentation, and more.
 +1-800-925-0609
 +55 81 97102-7382