
Pivot table or crosstab summary
On this sample it is shown a very important functionality : "Crosstable" style summary.
Creating a new report
1. Create a new report based on the SQL statement below.
SELECT
C.CompanyName,
D.DeptName,
R.DateRelease,
R.ValueRelease
FROM
companies C INNER JOIN releases R ON C.CompanyID = R.CompanyID
INNER JOIN departments D ON R.DeptID = D.DeptID
2. Select the fields C.CompanyName, D.DeptName e R.DateRelease. To do this click in Select Fields.
 |
||
Creating the groupings
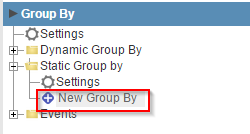
3. Open the Group By folder and click on "Static Group By >> New Group By".
 |
||
4. Select the fields: C.CompanyName and D.DeptName and click in Turn On/Off .
 |
||
Creating a total
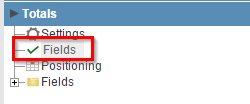
5. Click in Totals and then click on Fields.
 |
||
6. Select the R.ValueRelease field and then click in SUM.
 |
||
Setting up the crosstab summary option
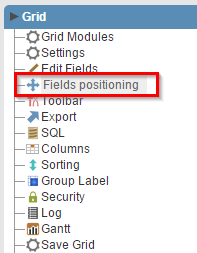
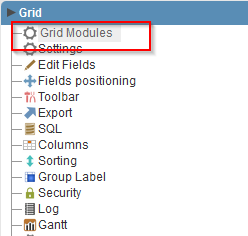
7. Back to the initial options "Grid Modules"
![]()
![]()
![]()
![]()
8 Mark the "Summary" as the initial module and enable it and the "Chart".
9. Access the Summary and click on Settings.
 |
||
10. Change the "Record count" property to "not show" and the field position "C.CompanyName" for the "X-axis".
 |
||
11. Click on the button "Run application".
![]()
![]()

![]()
![]()
Click on the button below to see the application running.
![]()