
Summary and Chart
This example shows how to create a report with the summary and chart on the same page.
Creating a new query
1. Create a new grid application based on the following SQL.
SELECT
products.ProductID,
categories.CategoryName,
products.ProductName,
products.UnitPrice,
products.UnitsInStock
FROM
categories INNER JOIN products ON categories.CategoryID = products.CategoryID
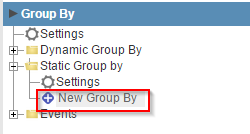
2. Open the Group By folder and click on "Static Group By >> New Group By".
 |
||
3.Select and enable the field categories.CategoryName.
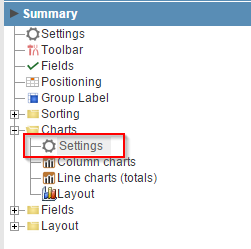
4.Access the guide "Summary" in the application menu, then click on "Charts>>Settings".
![]()
![]()
![]()
![]()
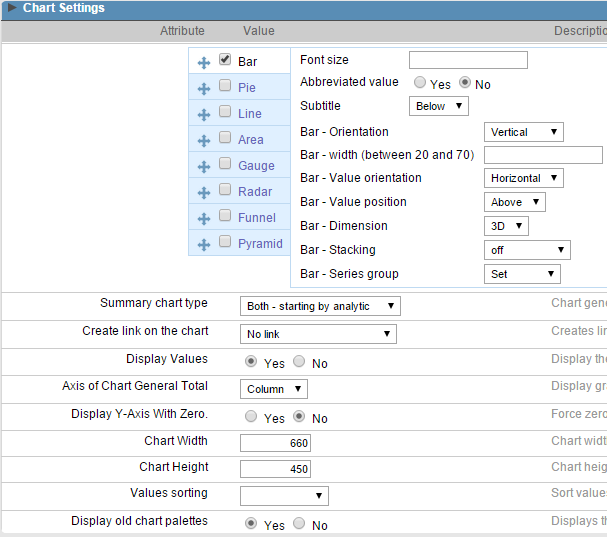
5. Configure as the image below.
![]()
![]()
![]()
![]()
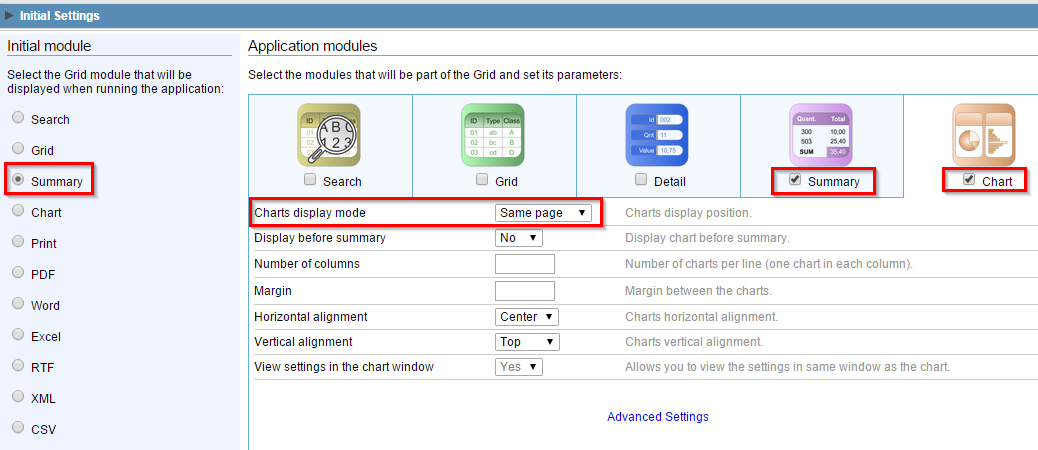
Showing only the Summary and Chart
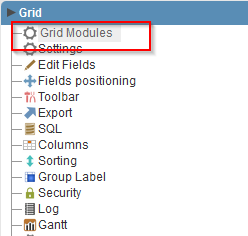
6. Back to the initial options "Grid Modules"
![]()
![]()
![]()
![]()
7. Check the "Summary" as the initial module and leave only this module and the "Chart" enabled. In the options of "Chart", change to display it in the "same page".
![]()
![]()
![]()
![]()
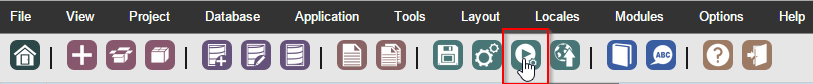
8. Click on the button "Run application".
![]()
![]()
![]()
![]()
Click on the button below to see the application running.
![]()