
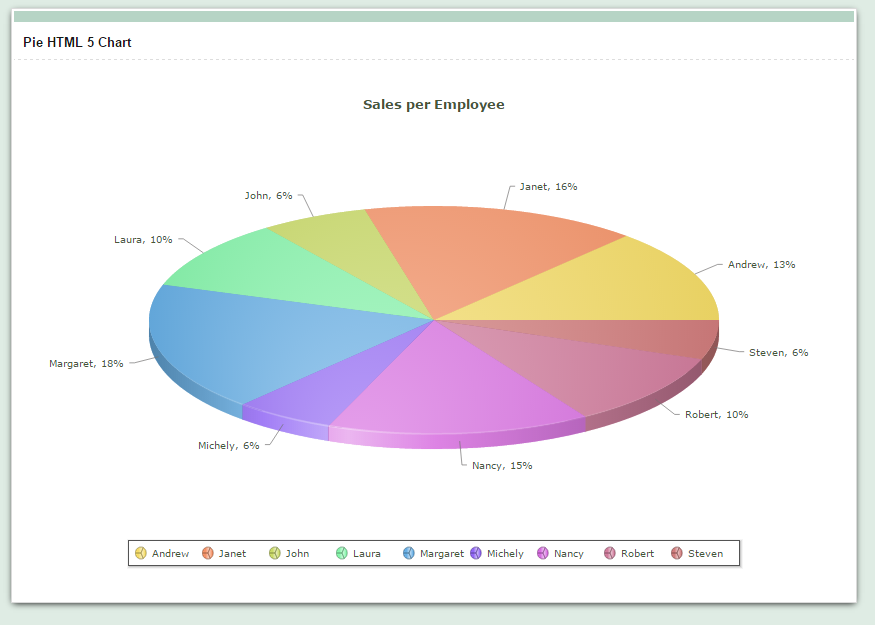
Pie Chart
In this example we will see how to create a Pie chart using the Grid application.
![]()
![]()
![]()
![]()
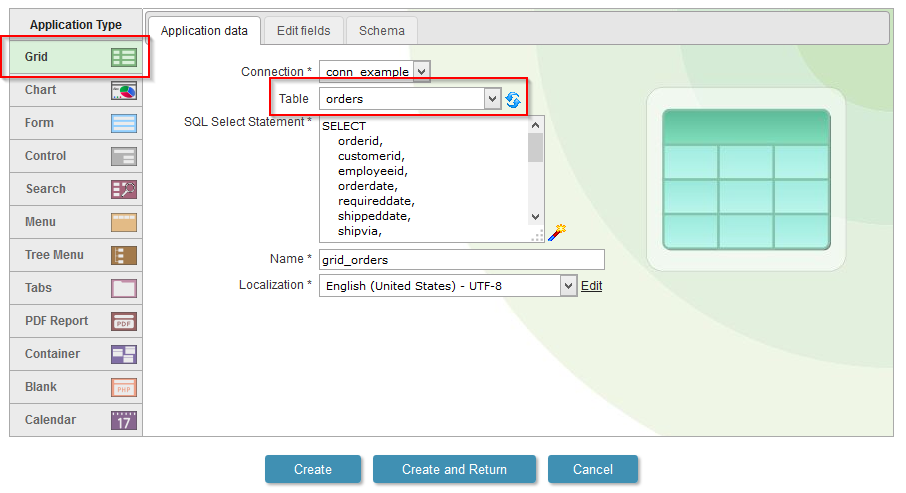
Creating the Grid application
1. We will create a new Grid application based on the orders table.
![]()
![]()
![]()
![]()
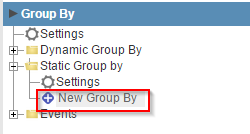
2. To enable the Chart in a Grid, we must create first of all a Group By in the application. Then go to the tab "Group by" in the application menu, then click on "Static Group by>> New Group by".
![]()
![]()
![]()
![]()
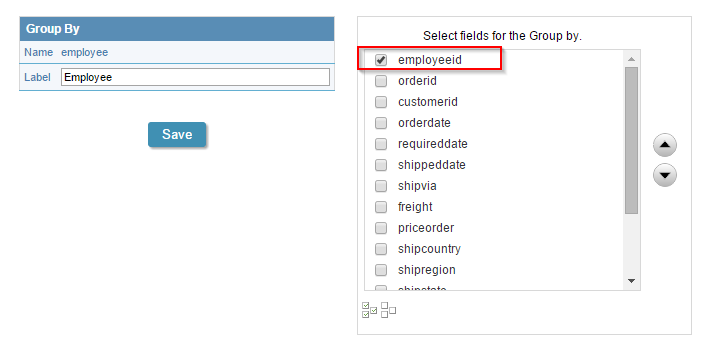
3. Select the field: "employeeid".
![]()
![]()
![]()
![]()
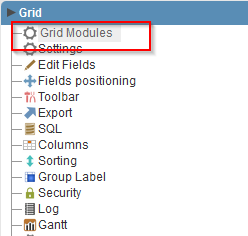
4. Back to the initial options "Grid Modules"
![]()
![]()
![]()
![]()
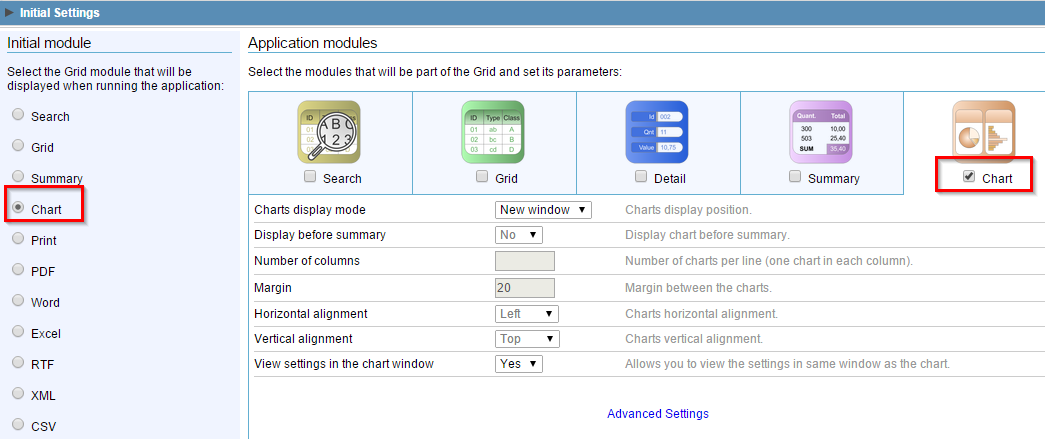
5. Mark the "Chart" as the initial module and enable just it.
![]()
![]()
![]()
![]()
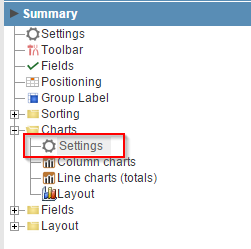
6. Access the guide "Summary" in the application menu, then click on "Charts>>Settings".
![]()
![]()
![]()
![]()
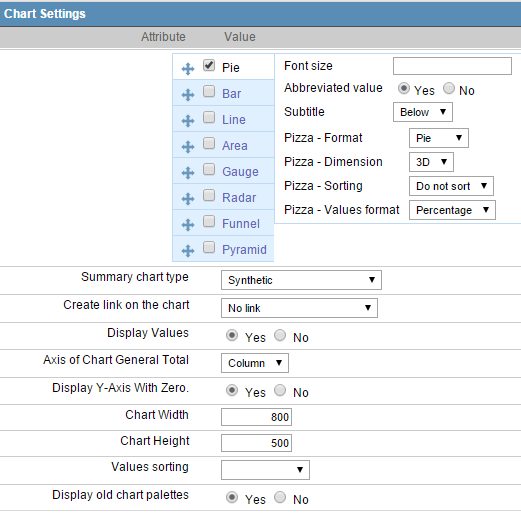
7. Select the chart of "Pie" and change the other settings according to the image.
![]()
![]()
![]()
![]()
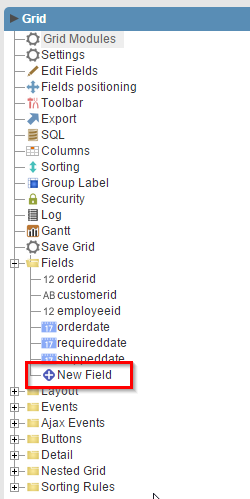
8. Go to "Fields >> New Field" option in the application menu
![]()
![]()
![]()
![]()
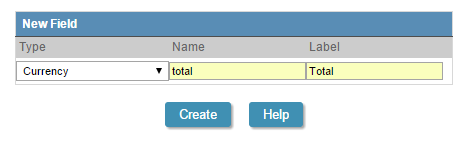
9. Create a field of type "currency" named "total".
![]()
![]()
![]()
![]()
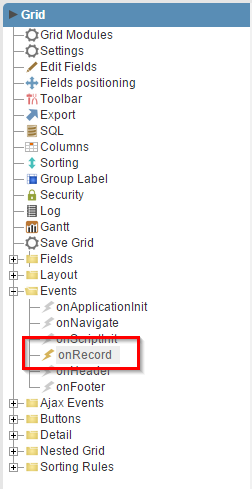
10. Go to the "Events >> onRecord" option in the application menu.
![]()
![]()
![]()
![]()
11. Use the following code in the event.
{total} = {freight} + {priceorder};
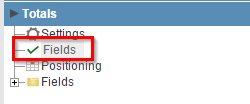
12.Go to the "Totals" tab in the application menu, then click on "Fields".
![]()
![]()
![]()
![]()
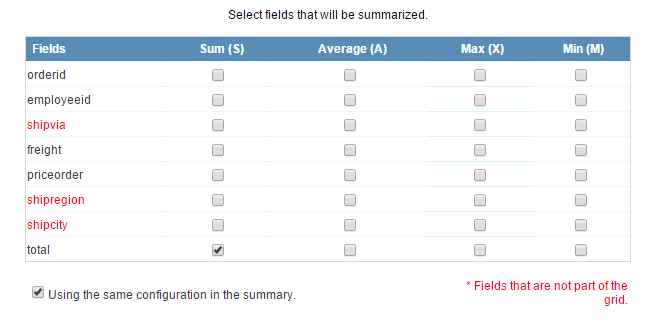
13. Check only the column "Sum" in the field "total" so that the sum of the values of this field is created.
![]()
![]()
![]()
![]()
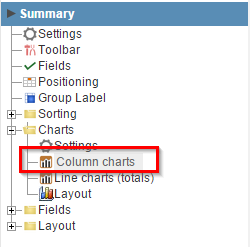
14. Now go to the "Summary" tab in the application menu, then click on "Charts >> Columns Charts".
![]()
![]()
![]()
![]()
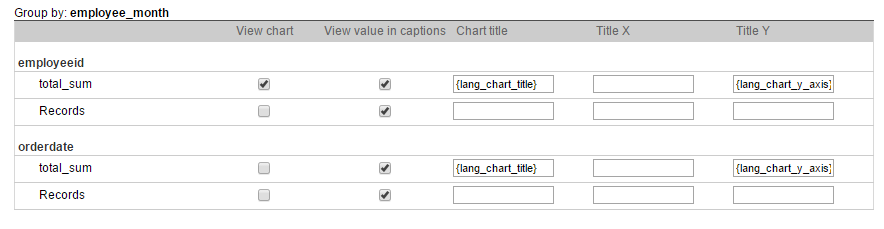
15. Check to display only the chart "total_sum" field "empoyeeid," according to the image.
![]()
![]()
![]()
![]()
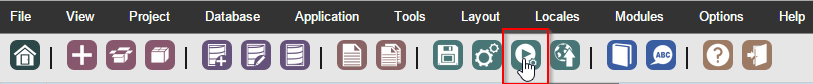
16. Click on the button "Run application"
![]()
![]()
![]()
![]()
Click on the button below to see the application running.
![]()