
Grid Application Using Dynamic Summary
In this example we will see how to create and use the Dynamic Group By in the Summary of Grid applications. It allows the end user to perform data groupings of his own choice and generate analytical reports and Pivot Tables dinamically.
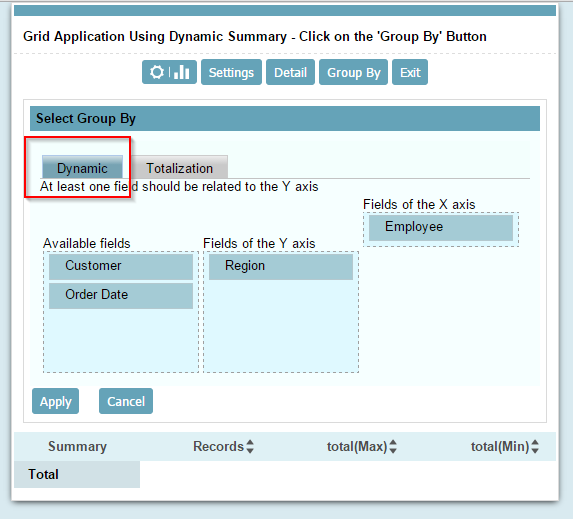
The application allows the end user to select the fields that will be part of the analytical report ...
![]()
![]()
![]()
![]()
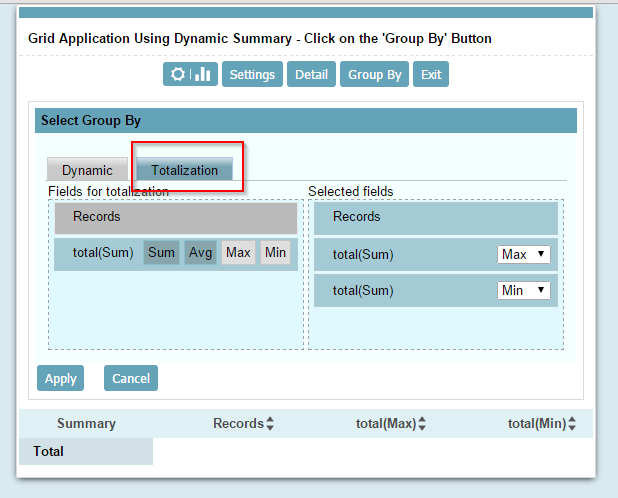
... as well as sum, average, minimum and maximum ...
![]()
![]()
![]()
![]()
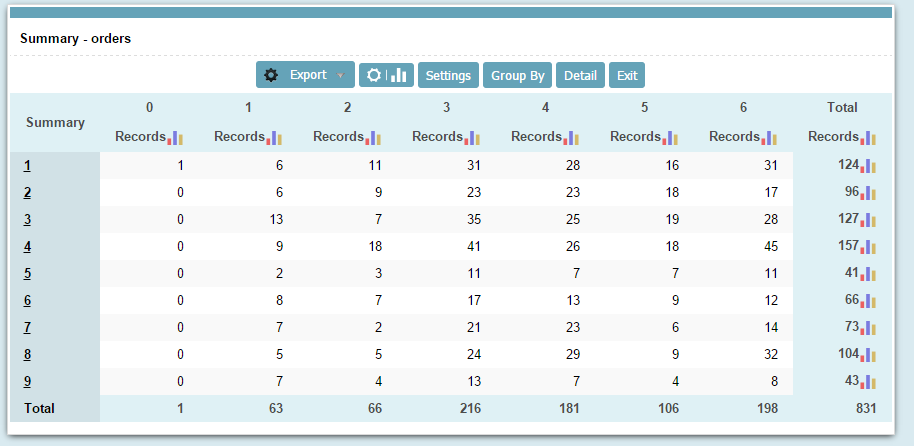
... and generate the report of a customized way.
![]()
![]()
![]()
![]()
Creating and configurating the application
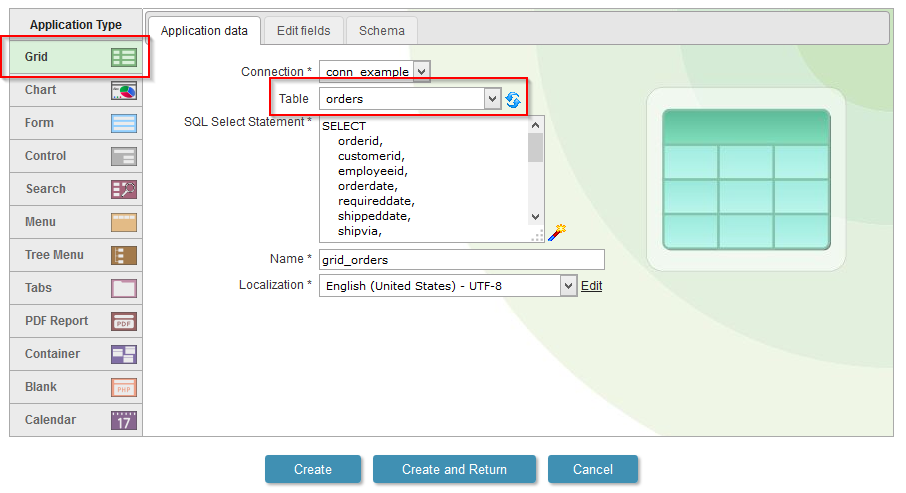
1. We will create a new Grid application based on the orders table.
![]()
![]()
![]()
![]()
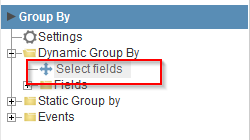
2. Open the guide "Group By" in the application menu, then click on "Dynamic Group By>>Select fields".
![]()
![]()
![]()
![]()
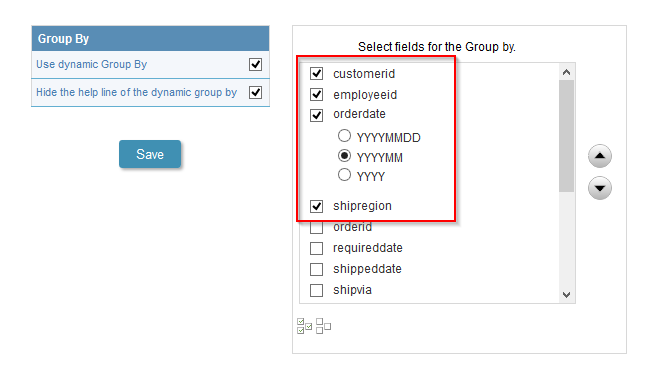
3. Select the fields: "customerid", "employeeid", "orderdate" (by month) and "shipregion".
![]()
![]()
![]()
![]()
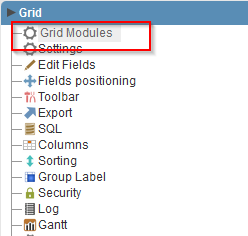
4. Back to the initial options "Grid Modules"
![]()
![]()
![]()
![]()
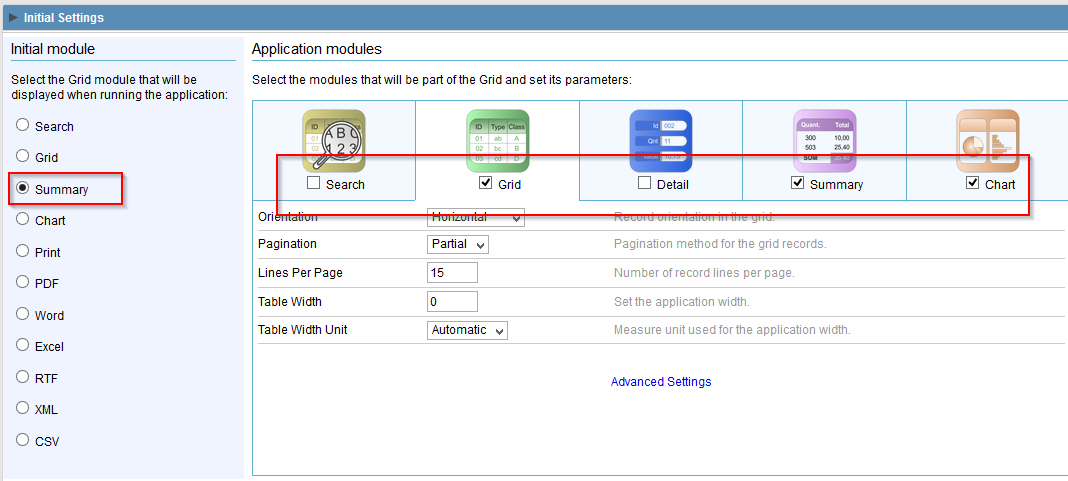
5. Mark the "Summary" as the initial module and enable just the modules: "Grid", "Summary" and "Chart".
![]()
![]()
![]()
![]()
6. Click on the button "Run application"
![]()
![]()

![]()
![]()
Click on the button below to see the application running.
![]()