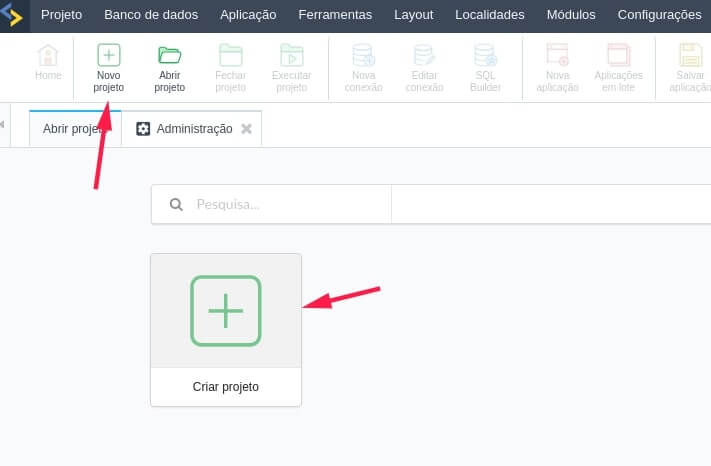
Overlapping Chart
new dashboard_charts_overlapping_97 see complete descriptionOverlapping bars & columns can be used to visualize two data sets on a single chart. Similar to a simple bar/column chart, this chart uses vertically/horizontally aligned rectangular bars/columns on one axis as data plots plotted against the discrete values shown on the other.