
Chart with toolbar
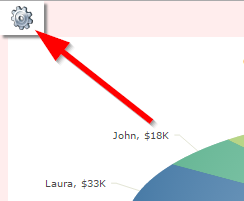
In this example we will see how to create and use the toolbar of charts that allows the end user to change the settings to display a graph at runtime.
![]()
![]()

![]()
![]()
![]()
![]()
![]()
![]()
![]()
![]()
![]()
![]()
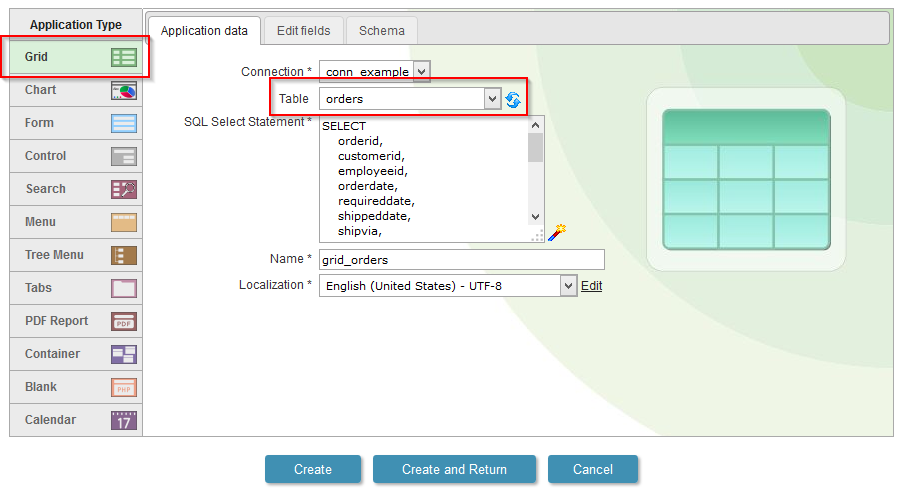
Creating the Grid application
1. We will create a new Grid application based on the orders table.
![]()
![]()
![]()
![]()
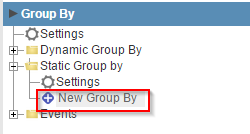
2. Open the guide "Group By" in the application menu, then click on "Static Group By>>New Group By".
![]()
![]()
![]()
![]()
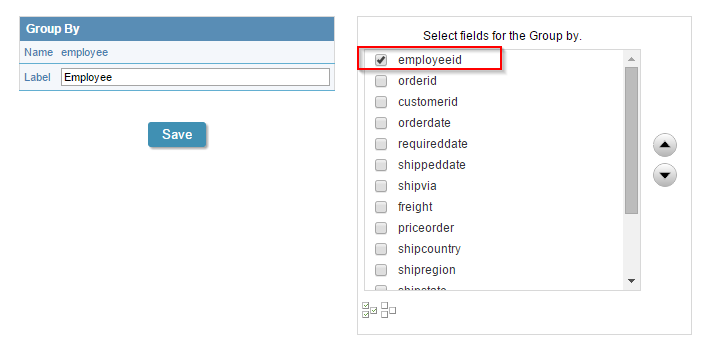
3. Select the field: "employeeid".
![]()
![]()
![]()
![]()
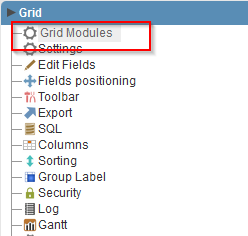
4. Back to the initial options "Grid Modules"
![]()
![]()
![]()
![]()
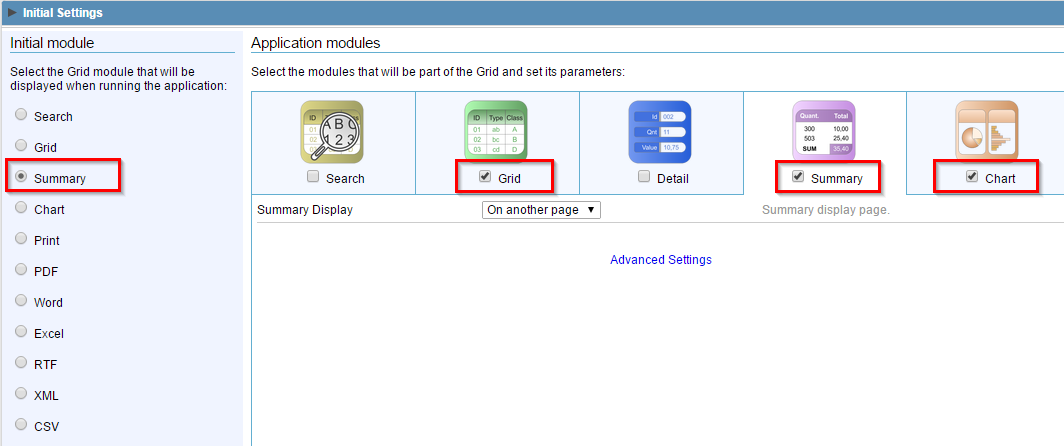
5. Mark the "Summary" as the initial module and enable just the modules: "Grid", "Summary" and "Chart".
![]()
![]()
![]()
![]()
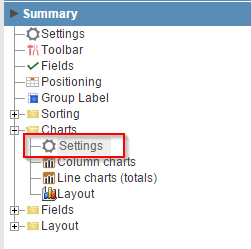
6. Access the guide "Summary" in the application menu, then click on "Charts>>Settings".
![]()
![]()
![]()
![]()
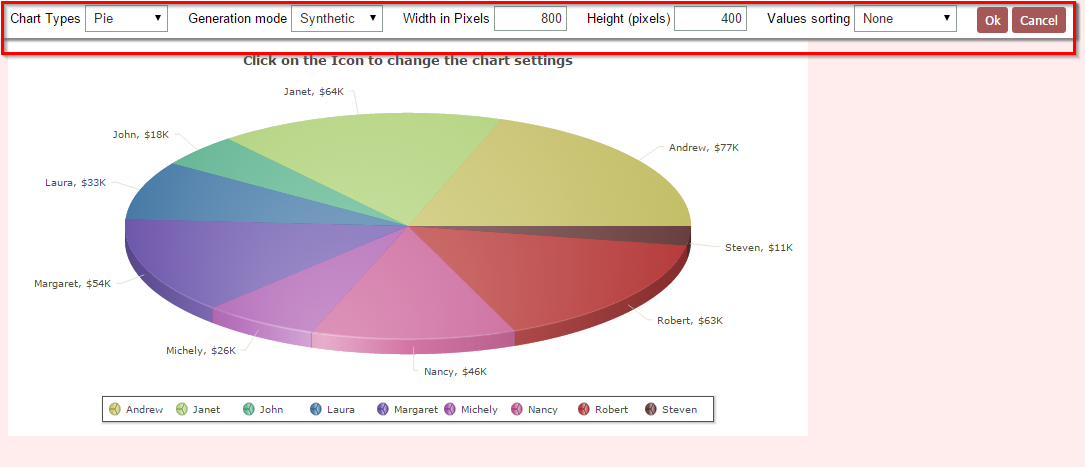
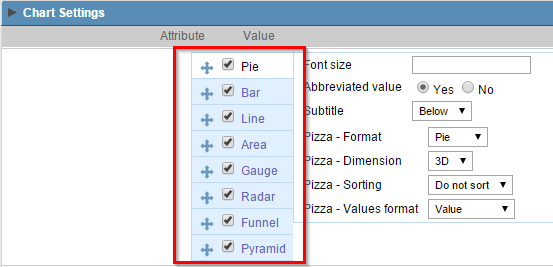
7. Select more than one chart option to enable the "Chart Settings" button in the application
![]()
![]()
![]()
![]()
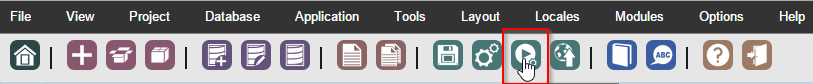
8. Click on the button "Run application"
![]()
![]()
![]()
![]()
Click on the button below to see the application running.
![]()