Chart Settings
Chart settings
In the chart Setup screen the user can change some application viewing options, which charts will be displayed, the labels, margins and alignments. Below detailing each of the available attributes
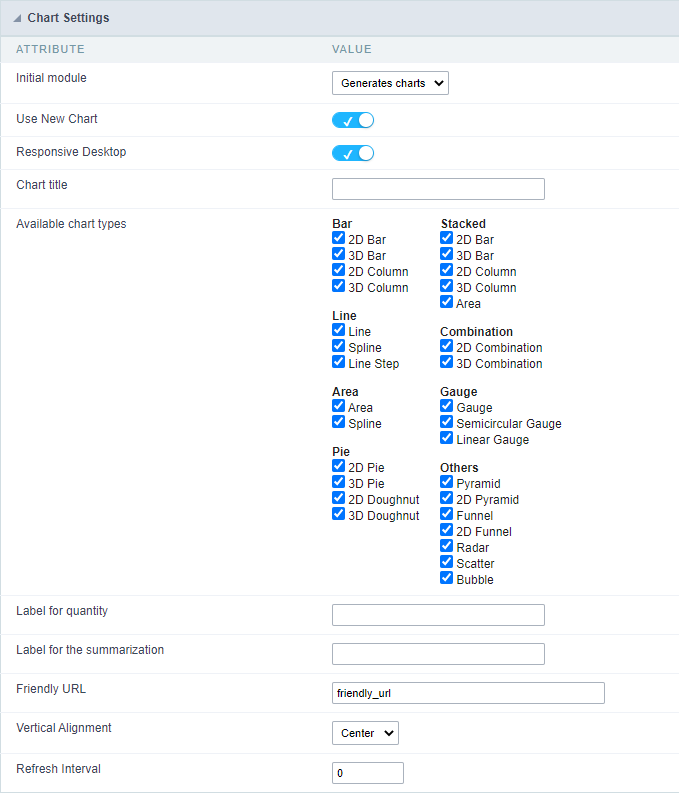 Chart settings interface
- Responsive Desktop : By checking this option the Chart will automatically adapt itself to the user’s screen according to the size of the browser.
- Chart title : This option allows you to set a title for the chart.
- Available chart types : List of available chart types for user’s choice within the final application via the button “Chart Types”. The graphics checked will be available, if the developer does not want to display a chart type must do not check them in this interface.
- Label for quantity : Label the y-axis for generic values of the record count.
- Label for summarization : Label the y-axis for generic values of the summary functions - sum, average, weighted average, maximum and minimum.
- Friendly URL : This field allows you to change the URL that will be called by the application. Allowed characters are the same available on URLs: a-z, A-Z, 0-9, -_. This option can also be changed on the home screen, on the “Friendly URL” column at the applications list.
- Horizontal Alignment: It allows to define the horizontal alignment of the application (Centered, Left, Right).
- Vertical Alignment: Allows you to define the initial vertical alignment of the application (Above, Centered and Below).
- Margins : Sets the application margins in pixels (up, down, right and left).
- Refresh Interval : Allows you to set a reload interval for the page, in seconds. When is set as zero, there will be no page reload.