Powerful reporting for better decisions
Reports & Data Analysis
Create interactive reports, analyze data from any angle and deliver insights with summaries, charts, filters and export options.
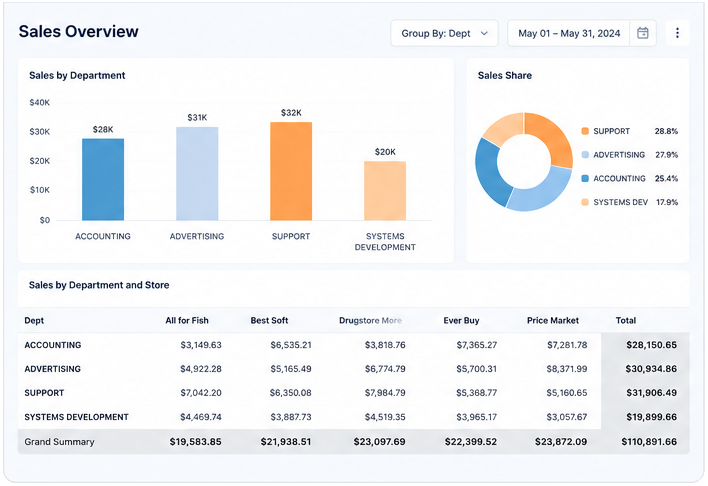
Data Analysis & Visualization
Transform raw data into meaningful insights with pivot tables, summaries, charts and dynamic grouping options.
Samples
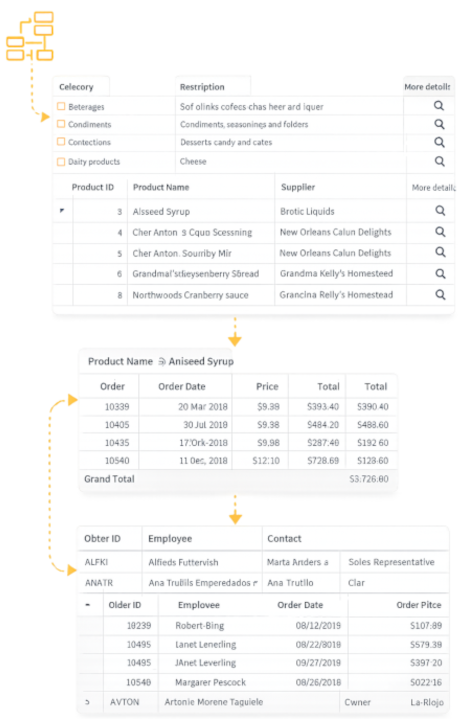
Data Modeling & Relationships
Build complex data relationships and explore details with nested grids, tree views, drill-down reports and query management.
Samples
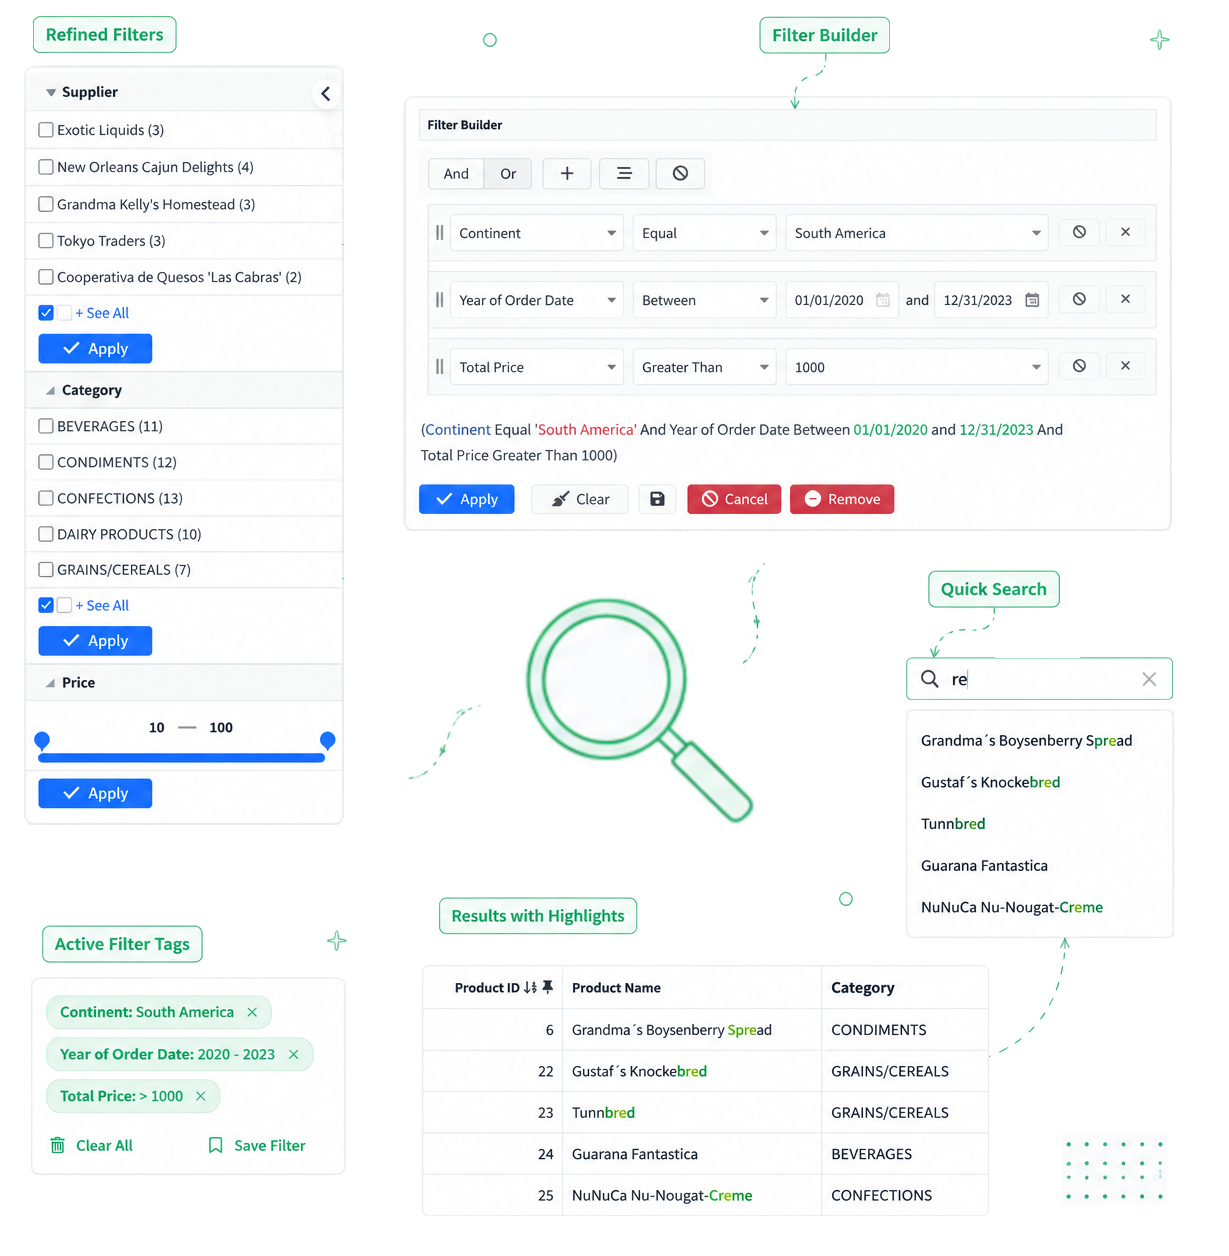
Filtering & Search
Empower users to quickly find the right information using powerful and intuitive filtering tools. Combine quick searches, refined filters, advanced conditions and dynamic filter tags to explore large datasets with speed and precision.
Use Quick Search for instant matching results, Refined Filters for categories and ranges, and the Filter Builder to create complex conditions with AND/OR logic, date intervals and custom rules — all through an easy visual interface.
Dynamic Filter Tags keep active filters organized and easy to manage, providing a smooth and efficient data exploration experience for modern applications.
Samples
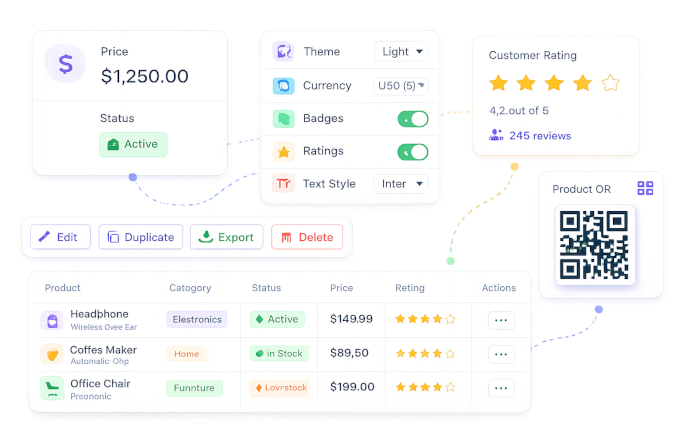
UI & Layout Customization
Create flexible report experiences with different grid types, action bars, custom fields and runtime configuration.
Samples
Export & Reporting
Deliver reports in the right format for every need, including PDF, Excel, JSON, Word, XML, CSV, print and email.
Samples

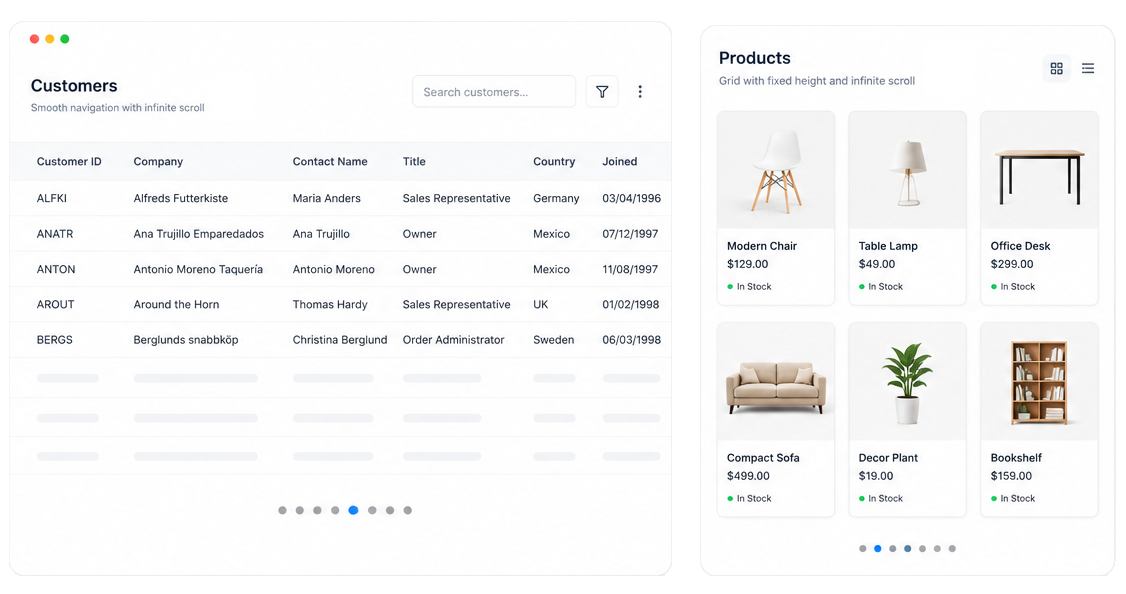
Navigation & Performance
Handle large datasets with smooth navigation and high-performance pagination patterns.
Samples
Code Customization
Extend reports with custom rules, formatting and automatic field customization.
sc_field.setProperty('price', {
format: 'currency',
symbol: '$'
});
Examples
Explore practical examples and see how each feature can be applied in real projects. Browse the gallery below to discover use cases, variations, and implementation ideas.
Data query in summary format to summarize the cost of each department within the companies analyzed.
Report using the Group by, Aggregates and Summary features to analyze the credit limits of each region according to their clients.
Creating a Pivot summary with charts.
Report with more than one Group By available to the end user to choose and change it on the fly.
This example shows how to create a report displaying summary and chart on the same page.
Fields like Rating, Smile and Thumbs can now be used within the Grid GroupBys and also in the Summary module, with the option of totaling to view the sums and averages of the ratings within the reports.
This example uses two grids, the first one based on the Customers table (Master) and the second is based on the Orders table (detail).
This example shows how to create a link between two Grids with parameter passing between them.
This example shows an application of Grid Master-detail on 3 levels, showing categories, products and orders.
Allows you to view the requests (Subquery) made by a client (Query), just by clicking the icon at the beginning of the row corresponding to the client record.
Example of a Filter application using 2 combobox, where the second will have its values reloaded according to the value selected in the first one.
Opening a form filter in a modal window.
Doing searches without leaving the application Grid using the Quicksearch.
Grid application with Dynamic Search where conditions can be added dynamically by the end user, according to the fields defined by the developer.
Improve your reports by adding a new Refined Search. By using your Grid reports you can restrict values according to the data universe. The new refined search will offer a slider component for selecting the ranges.
Displays labels with the value of each filtered field in the Grid
Create dynamic reports with nested filters and modal views, providing a richer and more interactive data analysis experience.
Using the QR code field on the Grid.
This example demonstrates how to create a Slide grid using blocks and a Image field.
Example of a simple horizontal Grid, created with the Scriptcase default values. The information of each record is displayed by lines
Grid application using "Inifinite Scroll" pagination. Here you can set the number of records, which will be loaded whenever the page scrolls.
Grid application with vertical orientation. The information in a record is displayed by columns
The Grid modal options received a more modern layout and a new dynamic and intuitive component for item selection.
Option to create inline buttons on records within the query body
Grid application using action bar with font awesome, grouped fields and the sc_change_css macro
Grids have a button that allows you to export the complete report into a PDF document.
Display a button to send the Grid exportation by email
Grid application with export option to Excel.
Grid application with option to export to JSON file format.
Grid export options for files: PDF, WORD, Excel, XML, CSV, RTF, JSON and printing.
Grid application using "Infinite Scroll" pagination. Here you can set the number of records, which will be loaded whenever the page scrolls.
Grid application using "Infinite Scroll" pagination, with fixed height. Here you can set the number of records, which will be loaded whenever the page scrolls. The fixed height retains the size of the application, creating a scrollbar as more records are loaded onto the grid.
Grid application using "Inifinite Scroll" pagination. Here you can set the number of records, which will be loaded whenever the page scrolls.
Ready to build powerful apps?
Start exploring examples or try Scriptcase for free.
Support
During the evaluation period you have free access to our technical support team. They will assist you with installation and general use of Scriptcase.
Access technical support »Purchase
Get started with Scriptcase today and enjoy the most efficient database-based web development tool.
Buy now