A Sankey chart visualizes flows between entities, where the width of each connection is proportional to the quantity it represents. It is ideal for understanding distributions, transfers, and relationships across stages.
Attention: You will need Scriptcase previously installed in your machine in order to follow these steps, if that's your case you can download it here.
How to import a system template in your Scriptcase
After loggin in, create a new system in your Scriptcase clicking at create project or new project
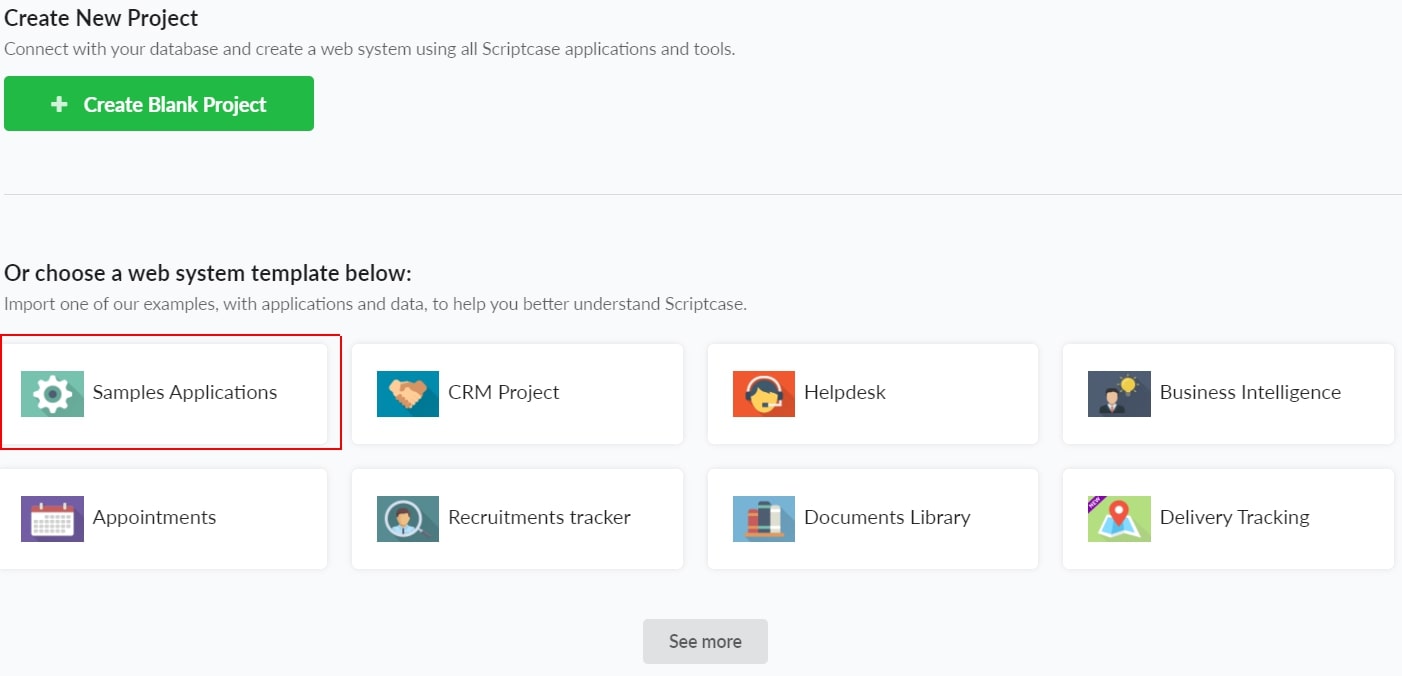
Choose the system template you want to use.
After choosing the name of your project, click in next and create a database connection to your system, we highly recommend you to use sqlite because you do not need to have a previously installed Database in your machine, afterwards click at next.
Now the system is ready to be generate, use and custom. After generating the system you are able to run it clicking at Run Project, in case it does not have any initial app make sure to choose the app login.php to be your initial app.
How to access a samples app in your Scriptcase.
Create a new system in your Scriptcase clicking at create project or new project.
Choose the samples template.
After choosing the name of your project, click in next and create a database connection to your system, we highly recommend you to use sqlite because you do not need to have a previously installed Database in your machine, afterwards click at next.
Open the samples project
Search your app in the searchbar by typing the name of the app: chart_orders_sankey